Glycohemoglobin A1C Test Results Explained
Glycohemoglobin A1C test results show your 2-3 month glucose average. Learn what the number means, how to read it, and where it can mislead you.

In this article(9)
The glycohemoglobin A1C test is one of the most important numbers in diabetes care, yet many people leave their doctor's office unsure what it actually measures. A clinician quotes a percentage, hands over a printout, and life moves on. But the science behind that single number explains a lot about why your daily readings, your meal patterns, and your medication choices matter the way they do.
This guide explains what glycohemoglobin A1C measures, how to read your result against the standard ranges, what the number tells your doctor that a fingerstick cannot, and the situations where the test can give a misleading picture. The goal is simple: leave your next appointment feeling like you understand the conversation.
What Is the Glycohemoglobin A1C Test
Glycohemoglobin, also called glycated hemoglobin or HbA1c, is hemoglobin with glucose chemically attached to it. Hemoglobin is the protein inside red blood cells that carries oxygen. When glucose floats around in your bloodstream, some of it sticks to hemoglobin in a slow, irreversible way. The more glucose in your blood over time, the more hemoglobin ends up coated with it.
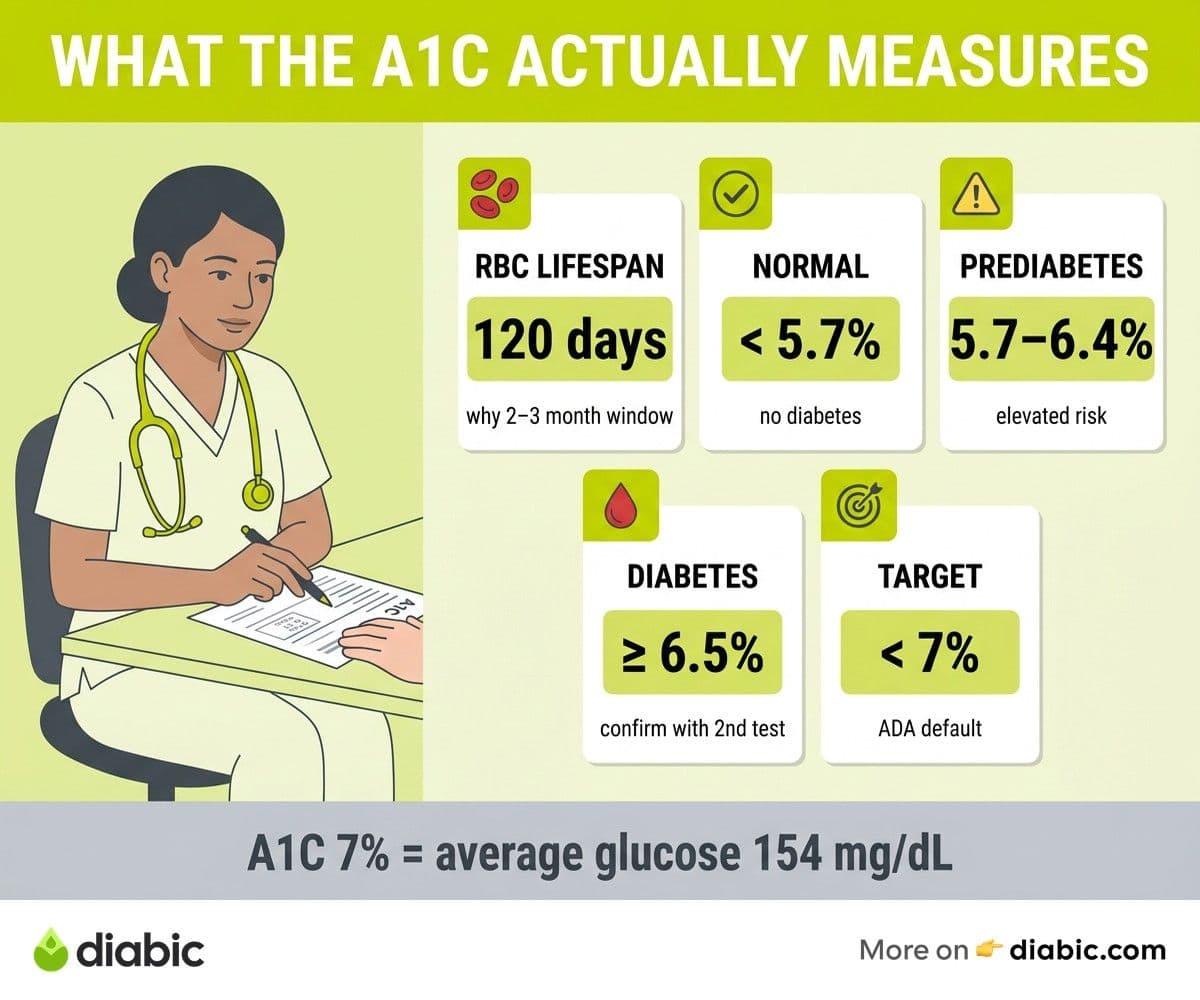
The A1C test measures the percentage of your hemoglobin that has glucose attached. A result of 6.5 percent means that 6.5 percent of the hemoglobin proteins in your bloodstream are glycated. This is not a snapshot of today, or even this week. It reflects the rolling average of your blood glucose over the prior two to three months because that is roughly the lifespan of a red blood cell.
You may see the test referred to by several names: HbA1c, hemoglobin A1c, A1C, or simply A1C. They all describe the same lab measurement. The standardization of A1C across labs in the United States is overseen by the National Glycohemoglobin Standardization Program (NGSP), which is why a result from one lab can reasonably be compared to a result from another.
Patient education from the NIDDK A1C test guide lays out the basic mechanics of the test. It is a simple blood draw with no fasting required, results typically come back in a day or two, and the test is used both to diagnose diabetes and to monitor diabetes management over time.
One important nuance: A1C is a percentage of your hemoglobin, not a glucose value. You cannot compare a 7 percent A1C directly to a 110 mg/dL fingerstick. They measure different things on different scales. The conversion to estimated average glucose, which we cover next, is what bridges those two worlds.
How to Read Your A1C Results
The diagnostic ranges established by the American Diabetes Association are the reference point for almost every conversation about A1C results. They are simple to remember:
- Normal: below 5.7 percent
- Prediabetes: 5.7 percent to 6.4 percent
- Diabetes: 6.5 percent or higher
For diagnosis, the ADA generally recommends confirming an elevated A1C with a second test (either a repeat A1C, a fasting plasma glucose, or an oral glucose tolerance test) before making a diabetes diagnosis official. This avoids over-diagnosing based on a single result that could have been affected by a temporary condition.
Once you have a confirmed diabetes diagnosis, the conversation shifts from diagnostic ranges to treatment targets. The ADA target for most non-pregnant adults with diabetes is below 7 percent, with adjustments based on age, life expectancy, comorbidities, and history of severe hypoglycemia. Older adults or those with a high risk of lows may have a more relaxed target of 7.5 to 8 percent. Pregnant individuals usually have a tighter target. For a deeper look at how the diagnostic numbers map to your day-to-day, our breakdown of the A1C normal range goes through the chart in more detail.
Estimated average glucose (eAG) translates A1C into a number that resembles your home glucose meter readings. Here is the conversion from the ADA:
This is where many people have an aha moment. An A1C of 8 percent corresponds to an average glucose of 183 mg/dL. If your fingersticks routinely run in the 120 to 140 range but your A1C comes back at 8, the math is telling you something is happening at times you are not testing, often overnight or after meals.
What Your A1C Number Tells Your Doctor
For your provider, A1C does several things at once. It establishes a long-term trend that single readings cannot. A 6.8 percent at one visit and a 7.4 percent three months later signals a real change in glucose patterns, regardless of what happened on the days you tested at home. Treatment decisions are anchored to that trend.
A1C is also a strong predictor of long-term complications. The landmark Diabetes Control and Complications Trial (DCCT) and its long-term follow-up (EDIC) showed that lower A1C levels in type 1 diabetes substantially reduced the risk of retinopathy, nephropathy, and neuropathy. Similar large studies in type 2 diabetes (UKPDS) showed that every 1 percent reduction in A1C lowered the risk of microvascular complications by roughly 35 percent. These findings remain the basis for current treatment targets, although newer evidence on time-in-range adds nuance.
When your A1C is rising despite your best efforts, your provider uses that signal to ask different questions. Is the current medication still doing what it should? Are post-meal glucose excursions higher than basal numbers suggest? Is there an underlying issue (sleep apnea, stress, an unrecognized infection, a thyroid problem) influencing glucose patterns? The number itself does not give the answer. It points to where to look. A clear understanding of type 1 vs type 2 often reframes those questions because the appropriate medication adjustments differ a lot between the two conditions.
A1C also informs medication dose adjustments. If you are on basal insulin and your A1C is above target while your fasting fingersticks are mostly fine, the issue is likely post-meal blood sugar levels, which usually points to mealtime adjustments rather than larger basal doses. The opposite pattern (high fasting, lower post-meal) points to nighttime basal coverage.
From my experience: For years I assumed my A1C was the boss number and my daily readings were just side characters. After my first six months on a CGM, I realized the relationship runs the other way. The A1C is the report card. The daily patterns are the work. When the patterns change, the report card follows about three months later. Looking at the two together gives a much fuller picture than either alone.
Limitations of the A1C Test
For all its usefulness, A1C is not a perfect test. It depends on the lifespan and behavior of red blood cells, which means anything that changes red blood cell turnover can skew the result. Knowing when the test may mislead is part of using it well.
Conditions that can falsely raise A1C include iron-deficiency anemia, vitamin B12 deficiency, and severe kidney disease. In iron deficiency, red blood cells live longer and accumulate more glucose attachment, pushing A1C upward even if glucose levels have not changed. Severe kidney failure can produce similar artifacts.
Conditions that can falsely lower A1C include any situation where red blood cells are being lost or replaced quickly. Recent significant blood loss, hemolytic anemia, recent blood transfusions, and certain treatments for anemia (erythropoietin, iron supplementation) can all reduce A1C below the level that would reflect actual glucose levels.
Hemoglobin variants like sickle cell trait (HbS) or HbC can also interfere with some A1C assays. The NGSP maintains a list of which assays are reliable for which variants. If you have a known hemoglobinopathy, your provider may use a different assay or rely more on alternative measures like fructosamine or CGM time-in-range data.
There is also growing recognition that A1C reliability may differ across racial and ethnic groups. A study by Herman and Cohen published in JCEM (2012) found that, on average, Black adults had A1C values about 0.4 percentage points higher than white adults at the same average glucose level. This does not mean the test is invalid for any group. It means that providers may need to interpret borderline results with this context in mind, and it reinforces why time-in-range and other measures are increasingly used alongside A1C.
This is why a single A1C result is rarely the only thing your doctor uses to make decisions. When A1C does not match your daily glucose readings (high fingersticks but low A1C, or the reverse), one of these factors may be at play. The next step is usually a conversation about which test gives the more accurate picture for you specifically.
How A1C Fits Into Your Overall Diabetes Monitoring
A1C is most useful when it is one input among several. Daily fingerstick or CGM data tells you what is happening now and lets you make immediate decisions about food, insulin, and activity. A1C tells you what the cumulative effect has been over the past two to three months. Neither replaces the other.
Time-in-range adds a layer that A1C cannot capture. Two people can have the same A1C but very different glucose patterns. One might spend most of their time hovering between 120 and 180 with few extremes. The other might spend half their day above 250 and the other half below 70, averaging out to the same number. The first person likely feels much better and faces lower complication risk despite the matching A1C. Our guide on time in range goes deeper on why the metric has become a cornerstone of modern diabetes care.
Trends matter more than individual results. A single 7.2 percent in isolation is just a number. A 7.2 percent that came down from 8.5 percent over a year is real progress. A 7.2 percent that drifted up from 6.4 percent is a flag. When you sit down with your provider, ask about the trend across the past several tests, not just the most recent one.
If you are testing at home with a meter, the best way to make A1C and daily readings work together is to test at varied times across the week. Pre-meal and two hours post-meal pairs are especially helpful, as are occasional 3 a.m. checks if you are concerned about overnight patterns. A reliable meter helps; our roundup of the best blood glucose meters compares accuracy and ease of use across popular options. The CDC monitoring guidance lays out the basics of what frequent self-monitoring looks like.
A few questions worth asking at your next appointment:
- How does my A1C compare to my last three results, and what does the trend suggest?
- Does my A1C match what my home meter or CGM is showing? If not, what could explain the difference?
- What target makes sense for me given my age, history, and lifestyle?
- Should we look at time-in-range or other measures alongside A1C?
FAQ
What does glycohemoglobin A1C mean?
This test measures hemoglobin (the oxygen-carrying protein in red blood cells) that has glucose chemically attached. The A1C test measures the percentage of your hemoglobin that has been glycated. Because red blood cells live about 120 days, the result reflects your average blood glucose over the previous two to three months. It is the same test as HbA1c or hemoglobin A1c, just under different names.
How often should you get an A1C test?
The ADA recommends at least twice a year for people with stable diabetes management who are at their target, and every three months for anyone whose treatment has recently changed or who is not at target. People newly diagnosed often have it checked more frequently in the first year as a baseline is established. Your provider may adjust based on pregnancy, illness, or treatment changes.
Can your A1C be wrong?
Yes, in some situations. Conditions that affect red blood cell lifespan or production, like iron-deficiency anemia, recent blood loss, hemolytic anemia, blood transfusions, severe kidney disease, or certain hemoglobin variants, can push A1C higher or lower than your actual glucose levels would predict. If your daily readings consistently disagree with your A1C, talk to your doctor about whether one of these factors applies to you and whether a different monitoring approach (like CGM time-in-range or fructosamine testing) would be more accurate.
The glycohemoglobin A1C test is a powerful tool when you understand what it does and what it does not show. Pair it with consistent daily monitoring and an honest conversation with your provider, and the number becomes a useful guide instead of an anxiety-inducing letter grade.
Dr. Shanto Arian is an internal medicine physician now specializing in clinical and aesthetic dermatology, with a parallel academic focus on epidemiology and public health. He holds an MBBS, MPH, MSc (UK), MRCP (UK), MRCPI (Ireland), Diploma in Dermatology (UK), and Diploma in Aesthetic Medicine (USA). Dr. Arian trained in internal medicine, including hospital work on hematology cases such as graft-versus-host disease, before moving toward dermatology. Skin is one of the earliest places diabetes shows itself, from acanthosis nigricans and diabetic dermopathy to slow foot wound healing, and that intersection is where his clinical and Diabic-review work meet. On Diabic, Dr. Arian medically reviews content on diabetes diagnosis, complications, dermatologic manifestations, and pharmacotherapy, ensuring every claim aligns with current ADA, NICE, and peer-reviewed literature.
Medically reviewed by
Dr. Rezwana Parvin Rumpa is an obstetrics and gynaecology specialist with clinical focus on gestational diabetes, PCOS, and fertility. She holds the MRCOG (Final Part) from the Royal College of Obstetricians and Gynaecologists in London, the MRCPI (Final Part) from the Royal College of Physicians of Ireland, and an MBBS from Shaheed Monsur Ali Medical College under Dhaka University. Dr. Rumpa serves as a Senior Medical Officer in the Obs and Gynae department at BRB Hospitals Ltd, where she has spent three years managing prenatal care, emergency obstetric cases, and women's-health surgery. On Diabic, she medically reviews content for women living with diabetes, with particular attention to pregnancy, PCOS, and reproductive-health intersections.
More from Devices & Technology
View all
Fasting vs Postprandial Glucose: What's the Difference
Fasting vs postprandial glucose readings tell different stories about your blood sugar. Learn what each number means and how to act on it.

Best Glucometer for Elderly and Low-Vision Users
Best glucometer for elderly and low-vision users: large displays, audio readouts, no-coding strips, and budget picks that make daily testing easier.

Online Diabetes Coaching: How to Choose a Good One
Online diabetes coaching can fill the gaps between doctor visits. Learn what credentials to check, red flags to avoid, and how to pick a quality program.
Clinician-reviewed habits, plain-language guides, and honest answers - the small shifts that make living with diabetes feel lighter, every day.