Glucose Variability Explained in Simple Terms
Glucose variability explained in plain language, including SD, coefficient of variation, the CV under 36% target, and why variability matters beyond.

In this article(14)
If your CGM trace looks like a roller coaster even when your average glucose is decent, you have already met the topic at the heart of this guide: glucose variability explained without the jargon. Variability measures how much your blood sugar swings up and down through the day, and research increasingly shows it matters independently of your A1C. Two people with the same average can live very different days, and the swings themselves shape both how you feel and your long-term risk picture.
Most diabetes data conversations start with averages. Average glucose, A1C, average time above range. Averages are useful, but they smooth over the bumps, and the bumps themselves matter. The gap between a smooth average and a bumpy reality is exactly where variability lives.
This post breaks down what variability actually is, how to read it on your reports, what causes it, and how to bring the swings down without obsessing over every reading.
Glucose Variability Explained: What It Actually Means
Glucose variability is the technical term for how much your blood sugar fluctuates over a given window of time. If you watch a CGM line for a day, the size and frequency of the wiggles is your variability. Big swings up and down equal high variability. Smaller, more predictable arcs equal low variability.
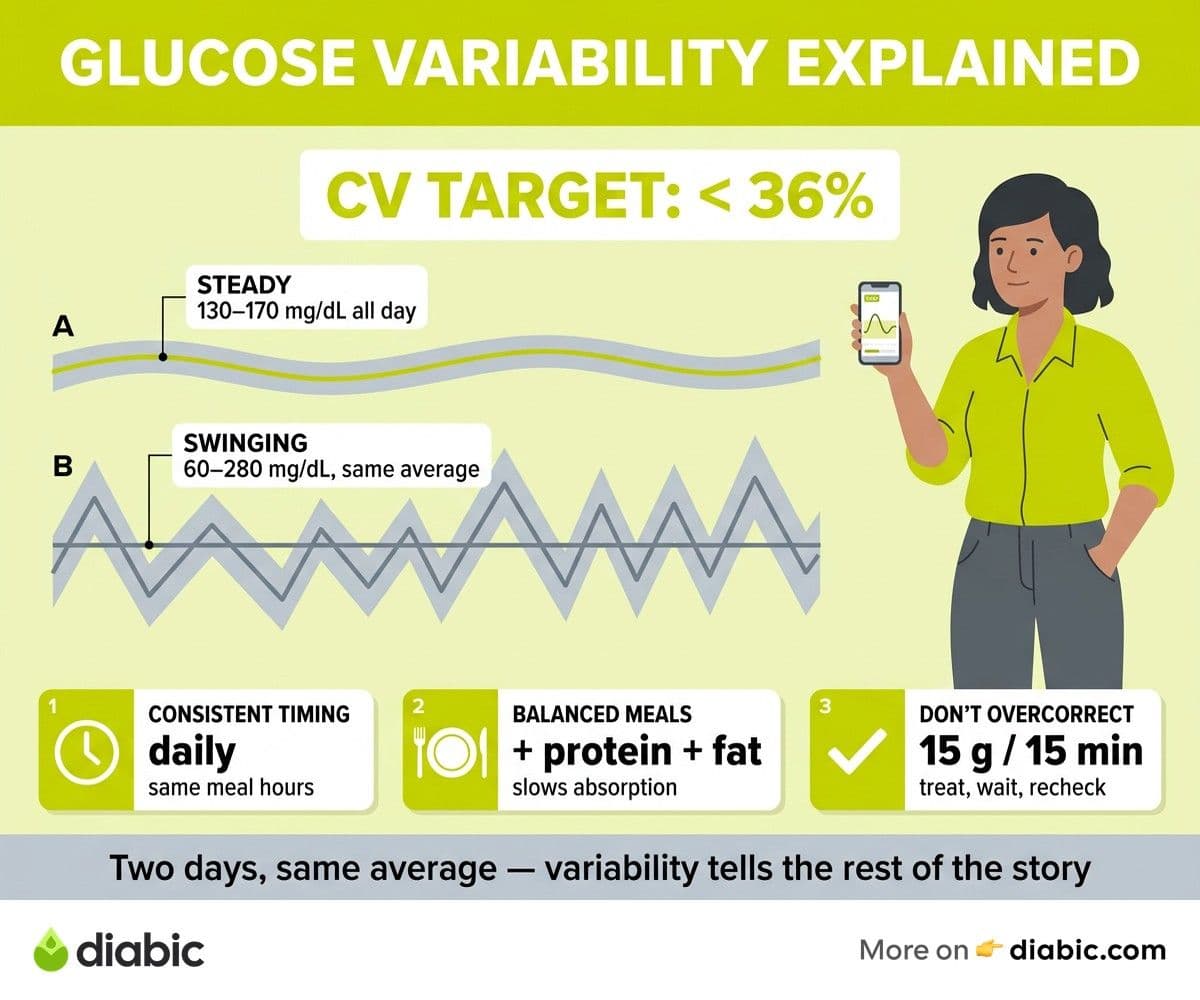
Two metrics quantify variability on most CGM reports. Standard deviation, or SD, measures the typical distance of your readings from the average, expressed in mg/dL. Coefficient of variation, or CV, divides SD by the average glucose and expresses the result as a percentage. The international consensus, published in Battelino et al., Diabetes Care 2019, set the target at CV less than 36% for stable glucose.
CV is generally the more useful number because it adjusts for how high or low your average is. An SD of 50 mg/dL means something different at an average of 120 than at an average of 200. CV puts everyone on the same scale.
How Variability Differs From Average
Imagine two days with identical average glucose at 150 mg/dL. On day one, your glucose stays between 130 and 170 the entire day. Quiet, steady, predictable. On day two, you bounce between 60 and 280 mg/dL with corrections, snacks, and spikes pulling you in every direction. Average glucose, the same. A1C contribution, similar. Variability, completely different. The second day burns more energy, raises more risk, and often feels worse to live through.
This is why looking at variability alongside time in range and average gives a much fuller picture than any single metric on its own. The numbers tell complementary stories, and missing one usually means missing why something feels off.
Why Glucose Variability Matters for Your Health
The case for paying attention to variability has grown over the last 15 years, driven by a mix of laboratory research and outcomes studies. The work of Monnier et al. in JAMA 2006 was an early signal that big glucose swings activate oxidative stress more strongly than steady high glucose does. Cells exposed to swinging glucose show more inflammatory markers and more endothelial damage in lab settings.
What that means in plain language is this. Going from 100 to 250 and back is harder on your blood vessels and tissues than sitting at 175 the whole time, even if the average works out the same. Variability is its own stressor.
Outcomes research has linked higher variability to increased risk of diabetes complications including retinopathy and certain cardiovascular events, though the evidence is stronger for some outcomes than others. The ADA Standards of Care 2026 explicitly mention CV as a metric clinicians should review on CGM reports, alongside time in range and average glucose.
How Variability Affects Daily Life
Beyond long-term risk, variability shapes how you feel hour to hour. Big swings often bring fatigue, brain fog, mood changes, and disrupted sleep. The body works harder to manage extremes, and that workload shows up in your energy and focus.
Many people who reduce their variability report sleeping better, having steadier energy through the afternoon, and feeling less reactive to small changes in food or activity. The biological case and the lived experience point the same direction. Steadier glucose tends to feel better and likely supports better long-term health.
What Causes High Glucose Variability
Variability has many causes, and most people have a handful of contributors rather than a single one. Spotting yours is the first step toward bringing variability down.
Inconsistent meal timing is a common driver. Eating breakfast at 7 a.m. on weekdays and noon on weekends, or skipping meals and then loading up later, creates large glucose swings tied to digestion and insulin timing. The body handles a predictable schedule better than an erratic one.
Carb-heavy meals without protein, fat, or fiber to slow absorption tend to create sharper spikes than balanced meals of the same total carb count. Pairing matters. The post on fasting vs postprandial glucose goes deeper into how meal patterns shape your numbers.
Missed or mistimed medication and insulin doses are another driver, particularly for people with type 1 diabetes. A bolus given five minutes before a meal versus 20 minutes before can change a 250 mg/dL spike into a 180 mg/dL one. Stress, illness, and hormonal fluctuations also contribute. Cortisol from a tough week at work or a viral infection both push glucose around in ways that look like random spikes if you do not factor them in.
Overcorrection and Exercise Patterns
Overtreating lows is one of the sneakier variability drivers. A reasonable hypoglycemia treatment is 15 grams of fast-acting carbs, but in the moment it is easy to grab a juice box, then a granola bar, then a few crackers, ending up well over 200 mg/dL an hour later. The crash followed by the rebound creates a swing that variability metrics catch sharply.
Irregular exercise patterns can do the same. A long walk on Saturday with nothing during the week creates a Saturday glucose drop and Sunday rebound that show up clearly in variability. Consistency, rather than intensity, often produces the steadiest patterns.
How to Read Glucose Variability on Your Reports
Every modern CGM report shows variability in some form. Knowing where to look turns the report from a wall of numbers into a useful picture.
In Dexcom Clarity, the overview page lists CV and SD next to your average glucose, and the AGP page shows variability visually through the band widths. In LibreView, the snapshot summary lists the same metrics, and the AGP view gives you the visual. Most clinic data platforms follow the same conventions.
The visual cue is simple. On the AGP report walkthrough, narrow bands at any given hour mean low variability at that time of day. Wide bands mean your glucose at that hour swings widely from day to day. Reading band width across the 24-hour curve tells you exactly when in your day variability is highest.
Comparing Across Weeks
Variability becomes most useful as a trend rather than a snapshot. A single bad week can spike your CV without telling you much. Looking at CV across four to eight weeks, on the other hand, reveals whether a change you made is actually moving the metric.
If your CV climbs from 33% to 41% over two months, something has shifted. Maybe your schedule changed, maybe a medication is timing differently, maybe stress at work is doing more than you realized. Bringing those data points to your provider gives them something specific to work with rather than a general "things feel off."
Helpful triggers for a provider conversation include a CV that has climbed by more than five percentage points over a few weeks, AGP bands that are clearly widening, or a stretch where lows and highs both show up frequently. The post on how to use your CGM app walks through generating reports you can share or screenshot before your visit.
How to Reduce Glucose Variability
Reducing variability is rarely about a single dramatic change. It is about a few habits that, stacked together, smooth the curve over weeks. Here are the levers that tend to move CV the most.
Consistent meal timing is the foundation. Eating around the same hours each day, with reasonably similar carb amounts, gives your body and any medications you take a predictable rhythm. Balanced macronutrient ratios, especially adding protein and fat to carb-heavy meals, slow absorption and shrink spikes. None of this requires perfection. Repetition does most of the work.
For insulin users, pre-bolusing by 10 to 20 minutes before meals, when it is safe and appropriate for your routine, often reduces the post-meal spike substantially. The change is timing, not dose. Talk to your doctor or diabetes educator about whether pre-bolusing makes sense for your insulin and routine.
Dawn Phenomenon, Trend Arrows, and Sleep
Dawn phenomenon, the natural early-morning glucose rise driven by hormones, is a common variability driver that often responds to basal adjustments worked out with your provider. If your CGM shows a steady climb from 3 a.m. to 7 a.m. most days, that pattern is worth flagging at your next appointment.
Using CGM trend arrows to make small, proactive corrections rather than waiting for an alert reduces the size of swings before they get out of hand. A reading of 160 mg/dL trending sharply upward calls for a different response than 160 trending flat. Acting on the arrow, not just the number, turns large swings into smaller ones.
Stress management and sleep hygiene are easy to dismiss, but both have measurable effects on variability. Cortisol from chronic stress and short sleep both push glucose in unpredictable ways. The interventions are not flashy: regular sleep and wake times, daily activity, breath work or another stress practice that fits your life. Their power shows up in the numbers over weeks.
From my experience: I have lived with type 1 diabetes for 14 years and worn CGMs for most of the last decade. The single change that dropped my CV the most was not a medication tweak. It was learning to stop chasing every reading. I used to over-correct lows, then over-correct the resulting highs, and the cycle would last hours. When I learned to treat 15 grams of fast carbs and wait the full 15 minutes before re-checking, my variability dropped meaningfully. Boring discipline, big result.
FAQ
What is glucose variability and why does it matter?
Glucose variability is the degree to which your blood sugar swings up and down over time, measured most often as standard deviation or coefficient of variation. It matters because high variability is associated with increased oxidative stress, complication risk, and worse day-to-day quality of life, even when average glucose looks fine. Two people with the same A1C can have very different variability, which is why CGM reports show both.
How do you reduce glucose variability?
Consistent meal timing, balanced meals, addressing post-meal spikes through pre-bolusing or carb awareness, treating lows without overcorrecting, regular sleep, stress management, and tuning basal insulin or medications with your provider are the most reliable levers. Most people see CV drop within four to eight weeks of stacking a few of these habits. Talk to your doctor about which levers are most relevant for your situation.
What is a good coefficient of variation for diabetes?
The international consensus target is CV less than 36% for stable glucose. CV between 36% and 40% is considered moderately variable. CV above 40% suggests significant variability worth discussing with your provider. Research suggests that getting CV below 36% often raises time in range as a side benefit, since smaller swings keep more of your glucose inside the 70 to 180 mg/dL target zone.
Glucose variability explained in this much detail can feel like a lot at once. The simple version is this. Average glucose tells you part of the story. Variability tells you the rest. Knowing your CV, watching it across weeks, and making small habit changes that smooth the curve will likely improve how you feel and the long-term picture. If you are not sure where to start, talk to your doctor or diabetes educator about which lever to pull first.
Shahriar P. Shuvo is the founder of Diabic. He has lived with diabetes for over 14 years, and built Diabic to deliver the practical, evidence-based self-management tools he wished existed when he was first diagnosed. By trade, Shahriar is a senior design and frontend engineer with 6+ years shipping products at Agora, Timescale (now Tiger Data), and ShareTrip. He writes from the intersection of lived diabetes experience and product craft, focused on what works in daily management rather than what sounds good in a textbook.
Medically reviewed by
Dr. Shanto Arian is an internal medicine physician now specializing in clinical and aesthetic dermatology, with a parallel academic focus on epidemiology and public health. He holds an MBBS, MPH, MSc (UK), MRCP (UK), MRCPI (Ireland), Diploma in Dermatology (UK), and Diploma in Aesthetic Medicine (USA). Dr. Arian trained in internal medicine, including hospital work on hematology cases such as graft-versus-host disease, before moving toward dermatology. Skin is one of the earliest places diabetes shows itself, from acanthosis nigricans and diabetic dermopathy to slow foot wound healing, and that intersection is where his clinical and Diabic-review work meet. On Diabic, Dr. Arian medically reviews content on diabetes diagnosis, complications, dermatologic manifestations, and pharmacotherapy, ensuring every claim aligns with current ADA, NICE, and peer-reviewed literature.
More from Devices & Technology
View all
Fasting vs Postprandial Glucose: What's the Difference
Fasting vs postprandial glucose readings tell different stories about your blood sugar. Learn what each number means and how to act on it.

Best Glucometer for Elderly and Low-Vision Users
Best glucometer for elderly and low-vision users: large displays, audio readouts, no-coding strips, and budget picks that make daily testing easier.

Online Diabetes Coaching: How to Choose a Good One
Online diabetes coaching can fill the gaps between doctor visits. Learn what credentials to check, red flags to avoid, and how to pick a quality program.
Clinician-reviewed habits, plain-language guides, and honest answers - the small shifts that make living with diabetes feel lighter, every day.