Are Your Blood Sugar Levels Normal? Chart by Age
A normal blood sugar levels chart by age, with fasting, post-meal, and A1C targets. Find out where your numbers should be and what to do if they are off.

In this article(17)
A normal blood sugar levels chart looks simple at first glance, but the numbers shift depending on your age, whether you have eaten, and what type of diabetes you manage. A reading of 130 mg/dL might be perfectly fine for a teenager after lunch and a red flag for a fasting adult. The same A1C of 7 percent can be a stretch goal for one person and a number to relax about for another.
This guide walks through the targets that the American Diabetes Association and the CDC use, then breaks them down by age and by situation. We will cover fasting numbers, post-meal numbers, A1C, and the newer measure called time in range. By the end you should be able to look at your meter or your CGM screen and know whether your numbers are where they should be.
Normal Blood Sugar Levels Chart: Quick Reference
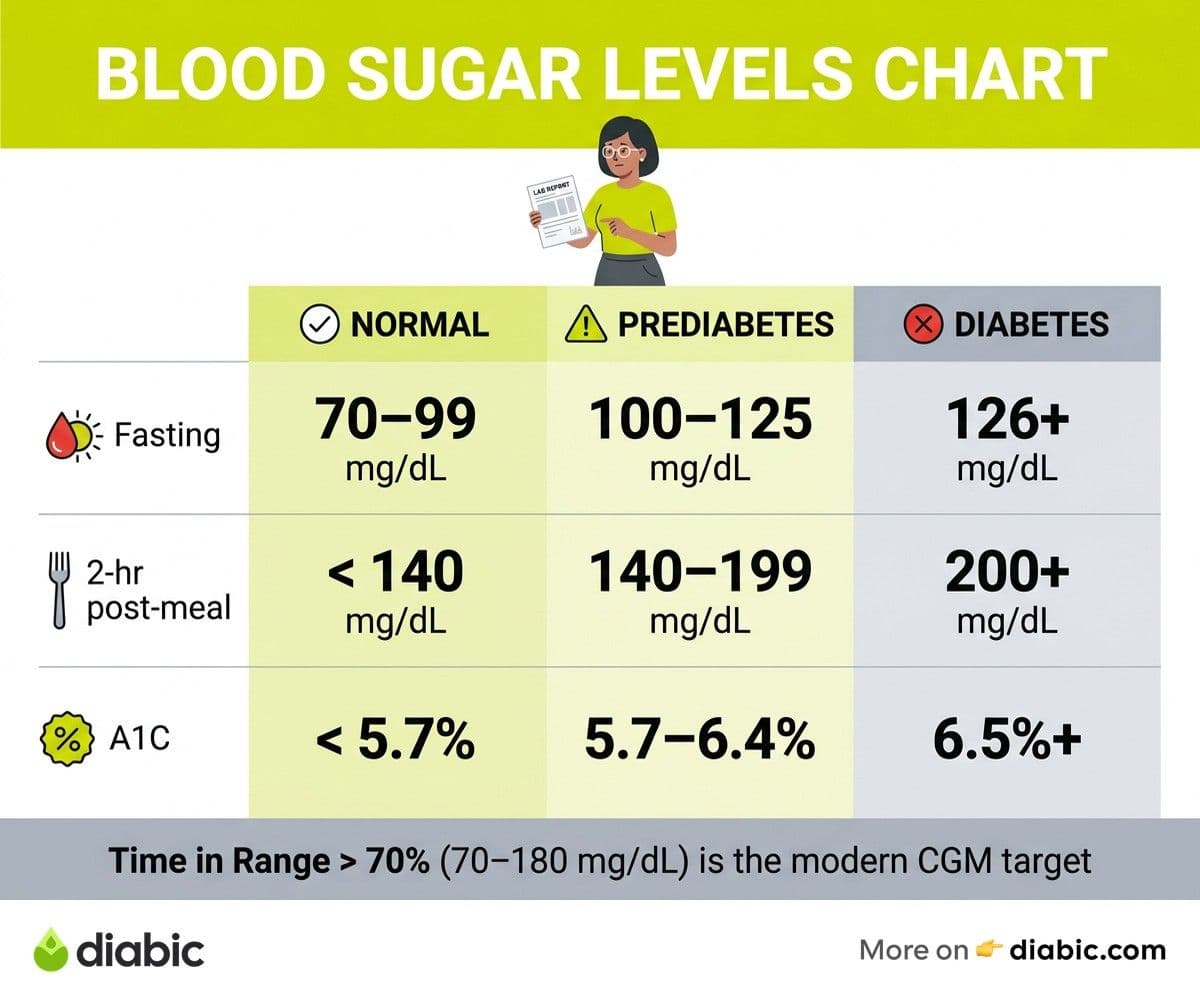
Here is the at-a-glance chart most clinicians work from, based on ADA Standards of Care:
Fasting numbers are taken after at least 8 hours without food or caloric drinks. If you want to learn more about what that single morning reading reflects, our piece on fasting blood sugar meaning goes deeper. Post-meal readings are usually checked 2 hours after the first bite, not the last bite, since blood sugar peaks earlier than people expect.
A1C is a longer-term picture. It reflects average blood sugar over roughly the past three months by measuring how much sugar has attached to red blood cells. A single high or low reading does not move A1C much, but a pattern over weeks does. The percentage roughly converts to an average glucose: an A1C of 7 percent is about 154 mg/dL on average, and 8 percent is about 183 mg/dL.
Blood Sugar Ranges by Age Group
Targets shift with age because the trade-offs change. A child's growing body and unpredictable activity demand wider ranges. A senior's higher hypoglycemia risk pushes the targets up so that lows do not become more dangerous than the highs they are trying to prevent.
Children Under 6
For very young children with type 1 diabetes, the ADA suggests a fasting target of 90 to 130 mg/dL and a bedtime target of 90 to 150 mg/dL. The A1C goal is generally below 7 percent, but providers often aim a bit higher to reduce the risk of severe lows during sleep. Toddlers cannot reliably report symptoms of hypoglycemia, so caregivers and CGMs do most of the warning work.
Children 6 to 12
School-age children typically aim for fasting numbers between 90 and 130 mg/dL and post-meal numbers under 180 mg/dL. The A1C target is below 7 percent for most kids in this group. Activity levels swing widely between school days, weekends, and sports seasons, so the day-to-day numbers will too.
Teens 13 to 17
Hormones complicate things in ways no chart can fully capture. Insulin sensitivity drops during puberty, which is why teens often need higher insulin doses than they did as younger children. Fasting targets stay around 90 to 130 mg/dL, post-meal under 180 mg/dL, and A1C below 7 percent for most. Mental health and self-care habits formed in these years often shape adult outcomes more than any single number.
Adults 18 to 64
Standard ADA targets apply: fasting between 80 and 130 mg/dL, post-meal under 180 mg/dL, and A1C below 7 percent. Some adults aim tighter (A1C below 6.5 percent) when it can be done safely, and others aim looser based on individual circumstances. Pregnancy targets are stricter, which we cover in a separate guide.
Seniors 65 and Older
Older adults often have looser targets to reduce hypoglycemia risk, which becomes more dangerous with age. According to the CDC guidance on diabetes care for older adults, an A1C of 7 to 7.5 percent is reasonable for healthy seniors, while those with multiple chronic conditions may aim for 8 to 8.5 percent. Fasting targets often run 90 to 150 mg/dL. For more on managing diabetes later in life, see our piece on diabetes in seniors.
What Is a Good Blood Sugar Level
"Good" is not one number. It is a range your healthcare provider sets based on your age, your type of diabetes, your other health conditions, and what is actually achievable for you. The ADA's general targets (fasting 80-130 mg/dL, post-meal below 180 mg/dL, A1C below 7 percent) work for most adults, but they are a starting point, not a rule.
The WHO diagnostic criteria align closely with ADA numbers, with diabetes diagnosed at fasting glucose of 126 mg/dL or higher or A1C of 6.5 percent or higher. Outside those thresholds, what counts as "good" depends heavily on context. A fasting reading of 110 mg/dL might be a personal best for someone with established type 2 and a problem to investigate for someone in good metabolic health.
Time in range (TIR) has become an increasingly important metric, especially for people using continuous glucose monitors. Time in range measures the percentage of the day your blood sugar stays between 70 and 180 mg/dL. Research published in Diabetes Care suggests that 70 percent or more time in range correlates with an A1C around 7 percent and lower complication risk. For seniors or anyone at high hypoglycemia risk, the target may be 50 percent in range with stricter limits on time below 70 mg/dL.
A1C goals also vary. Some adults aim for below 6.5 percent. Most aim for below 7 percent. Older adults or those with hypoglycemia unawareness may aim for 7.5 to 8 percent. None of these is "wrong" if it matches the reasoning your provider explains to you.
Understanding Normal Blood Sugar Range
Blood sugar moves throughout the day, even in people without diabetes. The pancreas releases insulin in pulses, the liver releases glucose between meals, and hormones like cortisol and adrenaline push numbers up during stress. A reading of 95 mg/dL at 8 a.m. and 130 mg/dL at 11 a.m. is normal physiology, not a problem.
The reasons for fluctuation are familiar to anyone who has watched a CGM trace for a week:
- Food. Carbs raise blood sugar most, but protein and fat shift the timing and the height of the peak.
- Exercise. Aerobic activity usually lowers blood sugar; intense or short bursts of exercise can raise it.
- Stress. Both physical (illness, injury, pain) and emotional stress release cortisol and adrenaline, which push glucose up.
- Sleep. Poor sleep and shifted sleep schedules raise insulin resistance the next day.
- Medications. Steroids, certain blood pressure drugs, and some antibiotics can raise blood sugar.
A one-time high reading is not a crisis. A pattern of highs over several days at the same time, like every morning before breakfast or every afternoon at 3 p.m., is what your provider needs to see. Tracking the pattern matters more than reacting to any single number. For prevention strategies, our guide on blood sugar spikes after meals walks through how to spot and reduce post-meal jumps.
From my experience: the single most useful habit I picked up in 14 years with type 1 was checking on the same days each week and writing down what was different. A high Tuesday morning could mean stress, a missed dose, or a bad infusion site. After a few weeks of notes, the patterns become obvious. Your provider can do a lot with two weeks of data and your honest description of what was happening.
How to Check and Track Your Levels
You have two main options for testing: a fingerstick meter and a continuous glucose monitor (CGM). Both have their place.
A fingerstick meter is cheap, accurate, and fast. You poke your finger, put a drop of blood on a test strip, and get a number in five seconds. The downside is that it only tells you what is happening at that moment. If you want to see a trend, you have to test multiple times.
A CGM uses a small sensor inserted under the skin to measure glucose every few minutes around the clock. The data appears on a phone or receiver as a graph, with arrows showing whether you are trending up, down, or steady. CGMs cost more than meters, but most insurance plans cover them for type 1 and increasingly for type 2 patients on insulin. The trends and alerts make them especially helpful for catching overnight lows or unexpected spikes.
When to check depends on your situation:
- Fasting (first thing in the morning): Reflects baseline and overnight liver glucose release.
- Before meals: Helps with insulin dosing decisions and gives a starting point for post-meal comparisons.
- 2 hours after meals: Shows how your body handled the food.
- Bedtime: Important if you take insulin or sulfonylureas, since overnight lows are common.
- When you feel "off": Always check if symptoms suggest a high or a low.
Logging your numbers is what turns data into insight. Apps connected to your meter or CGM (like the manufacturer's app, Glooko, or others) make this easier. A paper logbook works fine too, and some people prefer it. What you bring to your provider matters more than how you bring it: 2 to 4 weeks of data with patterns highlighted, plus notes about anything unusual, lets your appointment focus on what to change instead of guessing what is going on. Building this into a daily self-care routine makes the habit easier to keep.
When Blood Sugar Levels Signal a Problem
Some readings are normal variation. Others are a signal that something needs attention. The line between "interesting" and "act now" depends on the pattern, the type of diabetes you manage, and what else is going on.
Consistently above target for several days in a row usually means a medication, food, or activity change is overdue. If your fasting numbers have been running 160 to 180 mg/dL for a week and used to run 110 to 130 mg/dL, that is a pattern worth a call to your provider. The same is true for daytime numbers that climbed gradually over a month without an obvious reason.
Frequent lows below 70 mg/dL are equally important. They suggest that your insulin or oral medication dose may be too high, or that your routine has changed in a way the medication has not caught up with (more activity, less food, weight loss). Lows below 54 mg/dL are considered serious and need a real conversation about dose adjustment.
Rising A1C with good daily numbers is a puzzle, but a common one. It usually means there are spikes you are not catching, often overnight or right after meals when you are not testing. A CGM for two weeks usually answers the question. Knowing when blood sugar turns dangerous is its own topic, since some readings need urgent action rather than a routine appointment.
When to call your provider versus go to the ER comes down to a few clear lines:
- Blood sugar above 250 mg/dL with moderate or high ketones, especially with vomiting, signals possible DKA and is an ER visit.
- Blood sugar below 54 mg/dL that does not respond to fast carbs, or any loss of consciousness or seizure, is 911.
- A blood sugar above 600 mg/dL, especially in older adults with type 2, can signal HHS and is also an ER visit.
- Most other patterns can wait for a same-day or next-day call to your provider's office.
Frequently Asked Questions
What is a normal blood sugar level for my age?
For adults, fasting blood sugar between 70 and 99 mg/dL and post-meal under 140 mg/dL are considered normal. Children under 6 may have slightly wider ranges (fasting 90 to 130 mg/dL), and seniors over 65 often have slightly looser targets (fasting 90 to 150 mg/dL) to reduce hypoglycemia risk. Your healthcare provider can set personalized targets based on your situation.
What is a good blood sugar level?
For most adults with diabetes, a "good" range is fasting 80 to 130 mg/dL, post-meal under 180 mg/dL, and A1C below 7 percent. Older adults or those with hypoglycemia risk may aim for an A1C of 7.5 to 8 percent. Time in range of 70 percent or higher is a newer goal that correlates well with lower complication risk.
How often should I check my blood sugar?
It depends on your treatment. People on multiple daily insulin injections often check 4 or more times a day or use a CGM around the clock. People managing type 2 with diet and metformin may only check once a day or a few times a week. Talk with your provider about what schedule fits your treatment plan and goals.
What number is considered prediabetes?
Prediabetes is defined as fasting blood sugar of 100 to 125 mg/dL, a 2-hour post-meal reading of 140 to 199 mg/dL, or an A1C of 5.7 to 6.4 percent. Lifestyle changes (movement, weight management, sleep, balanced eating) may help return numbers to the normal range and reduce the risk of progression to type 2 diabetes.
Can stress raise blood sugar?
Yes. Stress hormones like cortisol and adrenaline tell the liver to release glucose, which raises blood sugar even without eating. Both short bursts of stress and long-term chronic stress can affect numbers. Managing stress through movement, sleep, and rest is part of managing blood sugar.
A normal blood sugar levels chart is a starting reference, not a verdict. Read your numbers alongside the context of the day: what you ate, how you slept, what your activity looked like, and whether anything else in your routine shifted. The same fasting reading can mean very different things on a recovery day after a long run versus a high-stress workday. Share your patterns with your provider every few months and adjust your targets as your life and your body change. The chart is meant to support that conversation, not replace it. Used that way, a normal blood sugar levels chart helps you read your own data with curiosity instead of anxiety.
Shahriar P. Shuvo is the founder of Diabic. He has lived with diabetes for over 14 years, and built Diabic to deliver the practical, evidence-based self-management tools he wished existed when he was first diagnosed. By trade, Shahriar is a senior design and frontend engineer with 6+ years shipping products at Agora, Timescale (now Tiger Data), and ShareTrip. He writes from the intersection of lived diabetes experience and product craft, focused on what works in daily management rather than what sounds good in a textbook.
Medically reviewed by
Dr. Shanto Arian is an internal medicine physician now specializing in clinical and aesthetic dermatology, with a parallel academic focus on epidemiology and public health. He holds an MBBS, MPH, MSc (UK), MRCP (UK), MRCPI (Ireland), Diploma in Dermatology (UK), and Diploma in Aesthetic Medicine (USA). Dr. Arian trained in internal medicine, including hospital work on hematology cases such as graft-versus-host disease, before moving toward dermatology. Skin is one of the earliest places diabetes shows itself, from acanthosis nigricans and diabetic dermopathy to slow foot wound healing, and that intersection is where his clinical and Diabic-review work meet. On Diabic, Dr. Arian medically reviews content on diabetes diagnosis, complications, dermatologic manifestations, and pharmacotherapy, ensuring every claim aligns with current ADA, NICE, and peer-reviewed literature.
More from Living with Diabetes
View all
A Gentle Chair Yoga Routine for people with diabetes
A gentle chair yoga for people with diabetes routine with safe poses, modifications for neuropathy, retinopathy, and joint pain, plus tips for older.

Shift Work and Diabetes: Managing Irregular Hours
Shift work and diabetes is a tough combination. Learn how to manage meals, sleep, medication, and blood sugar when your hours rotate or flip overnight.

Dating with Diabetes: When to Tell a New Partner
Dating with diabetes brings unique disclosure questions. Here is when to tell a new partner, what to say, and how to handle the conversation with.
Clinician-reviewed habits, plain-language guides, and honest answers - the small shifts that make living with diabetes feel lighter, every day.