Normal Blood Sugar Levels Chart: Are You in Range?
Use this normal blood sugar levels chart to check fasting, post-meal, and A1C numbers, and find out where your readings actually fall.

In this article(10)
Checking your reading against a normal blood sugar levels chart is one of the quickest ways to make sense of the numbers your meter or lab report keeps showing you. Whether you just got bloodwork back from your annual physical or you have been tracking daily glucose at home, knowing what falls inside a healthy range can replace guesswork with a clear answer. We see a lot of readers staring at three digits on a screen, unsure if 112 mg/dL is something to celebrate, watch, or call their doctor about.
The good news is that the major medical bodies, including the American Diabetes Association, the CDC, and the NIDDK, have published consistent reference ranges for fasting glucose, post-meal glucose, and A1C. We have pulled those numbers together below, paired with what they actually mean for your day-to-day health. Use the chart as a starting point, then have a real conversation with your care team about your individual targets.
From my experience: Living with type 1 for 14 years, I had to relearn how to read a single number when I switched to a Dexcom G6 around 2019. Before CGM, a 145 mg/dL meter check felt like a failed grade. With a trend arrow next to it, the same 145 going down with a flat arrow after lunch is a totally different story than 145 with two arrows up. The chart still matters, but trends and context end up doing most of the work in real life.
What Is Considered a Normal Blood Sugar Level?
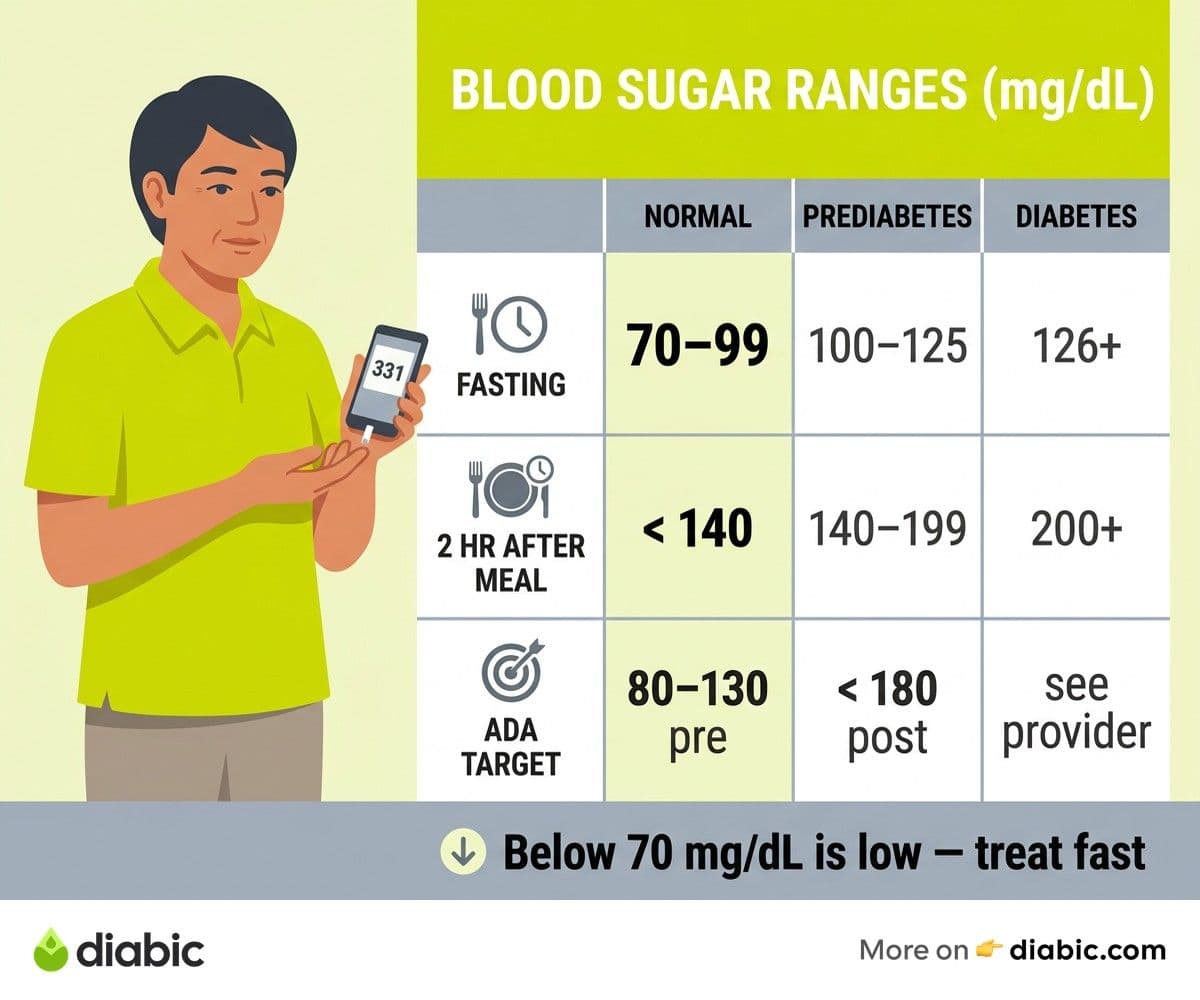
For adults without diabetes, a fasting blood sugar test level between 70 and 99 mg/dL is considered normal, according to the American Diabetes Association Standards of Care. Fasting means no food or caloric drinks for at least eight hours before the test, which is why most lab draws happen first thing in the morning. A reading in this band suggests your body is producing and using insulin the way it should overnight and between meals.
Once fasting numbers climb to 100 to 125 mg/dL, you are in the prediabetes range, sometimes called impaired fasting glucose. A reading of 126 mg/dL or higher on two separate tests typically meets the threshold for a diabetes diagnosis. These cutoffs are not arbitrary, they reflect decades of population research showing where complication risk starts to rise. If you want a deeper look at what prediabetes means for your long-term health, we walk through it in a companion piece.
You may notice that "normal" varies slightly between organizations. The World Health Organization, for example, sometimes uses 110 mg/dL as the upper bound of normal fasting glucose, while the ADA uses 99 mg/dL. The differences are small, and your doctor will use the framework most appropriate for your country and health profile. The A1C test, which reflects average blood sugar over roughly three months, has its own a1c normal range, and we cover what your A1C result means in detail elsewhere.
Normal Blood Sugar Levels Chart by Age
The table below pulls together the standard reference ranges for fasting glucose, two-hour post-meal glucose, and A1C. Use it the way a clinician would, as a starting point for conversation rather than a final verdict on your health.
These are general adult ranges. For children and teens, especially those with type 1 diabetes, targets are often individualized by age, school schedule, and growth patterns. The ADA has historically allowed slightly higher A1C goals for younger kids to reduce the risk of severe lows, since hypoglycemia in growing brains carries its own concerns. Pediatric endocrinologists usually set specific numbers in partnership with families.
Older adults sometimes have different targets too. A healthy 75-year-old with no other conditions may aim for the same numbers as a 45-year-old, but someone with multiple chronic illnesses or a history of falls may have an A1C goal closer to 7.5 or 8.0 percent. The ADA recommends loosening targets when tight management could trigger dangerous lows. Research published in Diabetes Care supports these individualized targets.
People with type 1 and type 2 diabetes often share similar lab targets, but the path looks different. Type 1 revolves around insulin dosing and carb matching, while type 2 often involves a mix of medication, food choices, and movement. Your individual numbers should always be set with your provider, who knows your full picture.
Blood Sugar Levels Before and After Eating
Glucose is meant to rise after meals. That is not a sign something is wrong, it is your body doing what it should when carbs enter the bloodstream. The real question is how high it rises and how fast it comes back down. According to the NIDDK guide on blood glucose monitoring, a healthy pancreas keeps post-meal spikes modest and brief.
For someone without diabetes, fasting glucose typically sits between 70 and 99 mg/dL. One hour after a meal, it might rise to roughly 120 to 140 mg/dL, depending on the meal. Two hours after the meal starts, glucose generally drops back below 140 mg/dL and continues toward the fasting baseline. The body's insulin response handles the work in the background.
For people managing diabetes, the curve looks different. The ADA recommends a pre-meal target of 80 to 130 mg/dL and a two-hour post-meal target of less than 180 mg/dL. These targets give some breathing room because insulin response is either reduced or absent. The pre-meal versus post-meal comparison below offers a quick visual reference.
What you eat matters a lot here. A plate of pasta with little protein or fiber will push glucose higher and longer than a plate with grilled chicken, vegetables, and a small portion of grain. Understanding your personal post-meal response helps you build meals that feel good in your body.
What Your Numbers Mean for Your Health
A single high reading is rarely cause for panic. Stress, illness, a poor night of sleep, or a particularly carb-heavy meal can all push glucose up temporarily. What clinicians watch for is a pattern, multiple readings outside your target range across different days and different times. That is when a number becomes a signal worth acting on.
Consistently high fasting numbers, especially above 126 mg/dL, often point to insulin resistance or insufficient insulin production. The CDC notes that prolonged hyperglycemia raises the risk of nerve, kidney, eye, and cardiovascular complications over time. The flip side is also true. If you are working on reversing insulin resistance through food, movement, and sleep changes, you can often see fasting numbers improve within weeks to months.
Consistently low readings deserve attention too. Glucose under 70 mg/dL is generally considered hypoglycemia, and readings under 54 mg/dL are clinically significant lows that can affect thinking and coordination. If you take insulin or certain oral medications, knowing the hypoglycemia emergency steps is part of basic preparedness. The American Association of Clinical Endocrinology, through its AACE clinical guidelines, emphasizes that avoiding lows is just as important as avoiding highs.
Trends matter more than individual numbers. A diabetes test taken on one stressful Monday morning is a snapshot. Two weeks of fasting readings, paired with a few post-meal checks, paints a far more useful picture. We encourage readers to think in patterns, not panic spikes.
How to Track and Use Your Blood Sugar Data
Home glucose monitoring usually involves a finger-stick meter, a small drop of blood on a test strip, and a reading in about five seconds. It is the most accessible way to check in with your numbers, and most insurance plans cover meters and strips for people with diabetes. The trick is choosing when to test so the data actually tells you something useful.
Continuous glucose monitors, or CGMs, take the picture further. They sit on your arm or abdomen, sample interstitial fluid every few minutes, and stream readings to your phone. Instead of seeing five data points a day, you see hundreds, including overnight patterns and post-meal curves you would otherwise miss. The CDC blood sugar monitoring page includes a helpful overview of when CGMs are recommended.
Logging strategies make those data points more useful. We suggest writing down what you ate, how you slept, any stress events, and any movement alongside your readings. Patterns emerge faster than you might expect. Apps like Diabic, MySugr, and others let you tag entries and spot trends without keeping a paper journal, which makes appointments with your care team much more productive.
Bring data, not memories, to your next visit. A printout of two weeks of readings, or a summary from your CGM app, gives your provider something concrete. They can spot dawn phenomenon, post-dinner spikes, or overnight lows that gut feeling alone would miss.
When to Talk to Your Doctor About Your Numbers
A few patterns warrant a phone call sooner rather than later. Talk to your doctor about readings consistently outside your target range across two weeks, especially if you feel unusual thirst, frequent urination, blurred vision, or fatigue. These are early signals worth a check-in, and we cover how to know if you have diabetes in a separate piece.
Symptoms paired with numbers are a stronger trigger than numbers alone. A fasting reading of 145 mg/dL with no symptoms might wait until your next routine visit. The same reading with persistent thirst and blurry vision usually warrants a call this week. Trust your body when it tells you something has shifted.
Never adjust insulin doses or stop a medication on your own. Talk to your doctor about any change you are considering, even one that feels small. Your provider can run additional labs, look at your full medication list, and help you make changes safely. Self-adjusting carries real risk, and a five-minute call can save weeks of trouble.
How often you review your data depends on your treatment plan. People on insulin often share data every one to three months, while those managing prediabetes or stable type 2 may go six months between detailed reviews. Either way, the normal blood sugar levels chart above is a reference, not a substitute for the personalized targets your care team sets for you.
Frequently Asked Questions
What is a normal blood sugar level by age?
Normal fasting blood sugar for adults is typically 70 to 99 mg/dL. For children and teens, targets may be slightly different, and pediatric endocrinologists usually set personalized goals based on age and treatment. For older adults, healthcare providers sometimes set slightly higher targets to reduce the risk of hypoglycemia, especially when other health conditions are in the mix. Always confirm your personal target with your doctor, because age alone does not tell the full story.
What should blood sugar be 2 hours after eating?
For most people without diabetes, blood sugar returns to below 140 mg/dL within two hours of starting a meal. For people managing diabetes, the ADA suggests a target of less than 180 mg/dL two hours after a meal, though your provider may set a different goal based on your medication, meal pattern, and individual response. Tracking your two-hour reading after the same meal a few times can show how your body responds to specific foods.
How accurate is a normal blood sugar levels chart for everyone?
A chart gives you a population-level reference, not a personalized target. Two people with the same reading can have very different stories behind the number, including stress, illness, and recent meals. Use it to orient yourself, then talk with your provider about your individual target.
Shahriar P. Shuvo is the founder of Diabic. He has lived with diabetes for over 14 years, and built Diabic to deliver the practical, evidence-based self-management tools he wished existed when he was first diagnosed. By trade, Shahriar is a senior design and frontend engineer with 6+ years shipping products at Agora, Timescale (now Tiger Data), and ShareTrip. He writes from the intersection of lived diabetes experience and product craft, focused on what works in daily management rather than what sounds good in a textbook.
Medically reviewed by
Dr. Shanto Arian is an internal medicine physician now specializing in clinical and aesthetic dermatology, with a parallel academic focus on epidemiology and public health. He holds an MBBS, MPH, MSc (UK), MRCP (UK), MRCPI (Ireland), Diploma in Dermatology (UK), and Diploma in Aesthetic Medicine (USA). Dr. Arian trained in internal medicine, including hospital work on hematology cases such as graft-versus-host disease, before moving toward dermatology. Skin is one of the earliest places diabetes shows itself, from acanthosis nigricans and diabetic dermopathy to slow foot wound healing, and that intersection is where his clinical and Diabic-review work meet. On Diabic, Dr. Arian medically reviews content on diabetes diagnosis, complications, dermatologic manifestations, and pharmacotherapy, ensuring every claim aligns with current ADA, NICE, and peer-reviewed literature.
More from Treatment & Medication
View all
Recognizing Diabetic Coma Warning Signs Early
Learn to spot diabetic coma warning signs early. We cover DKA, HHS, and severe hypoglycemia symptoms, plus when to call 911 for immediate help.

Switching to Injectable Diabetes Medication: What to Expect
Switching to injectable diabetes medication can feel daunting. Learn what to expect, how to manage side effects, and why this step is progression, not.

Hyperglycemic Hyperosmolar Syndrome: Warning Signs to Know
Hyperglycemic hyperosmolar syndrome is a serious type 2 diabetes emergency. Learn the warning signs, triggers, and when to call 911 for HHS care.
Clinician-reviewed habits, plain-language guides, and honest answers - the small shifts that make living with diabetes feel lighter, every day.